Appearance
Dispatch Inspection Components
Opening the Detail Screen
Tap a dispatch inspection card to open the detail screen. The header is fixed at the top; the inspection items list is scrollable below it.
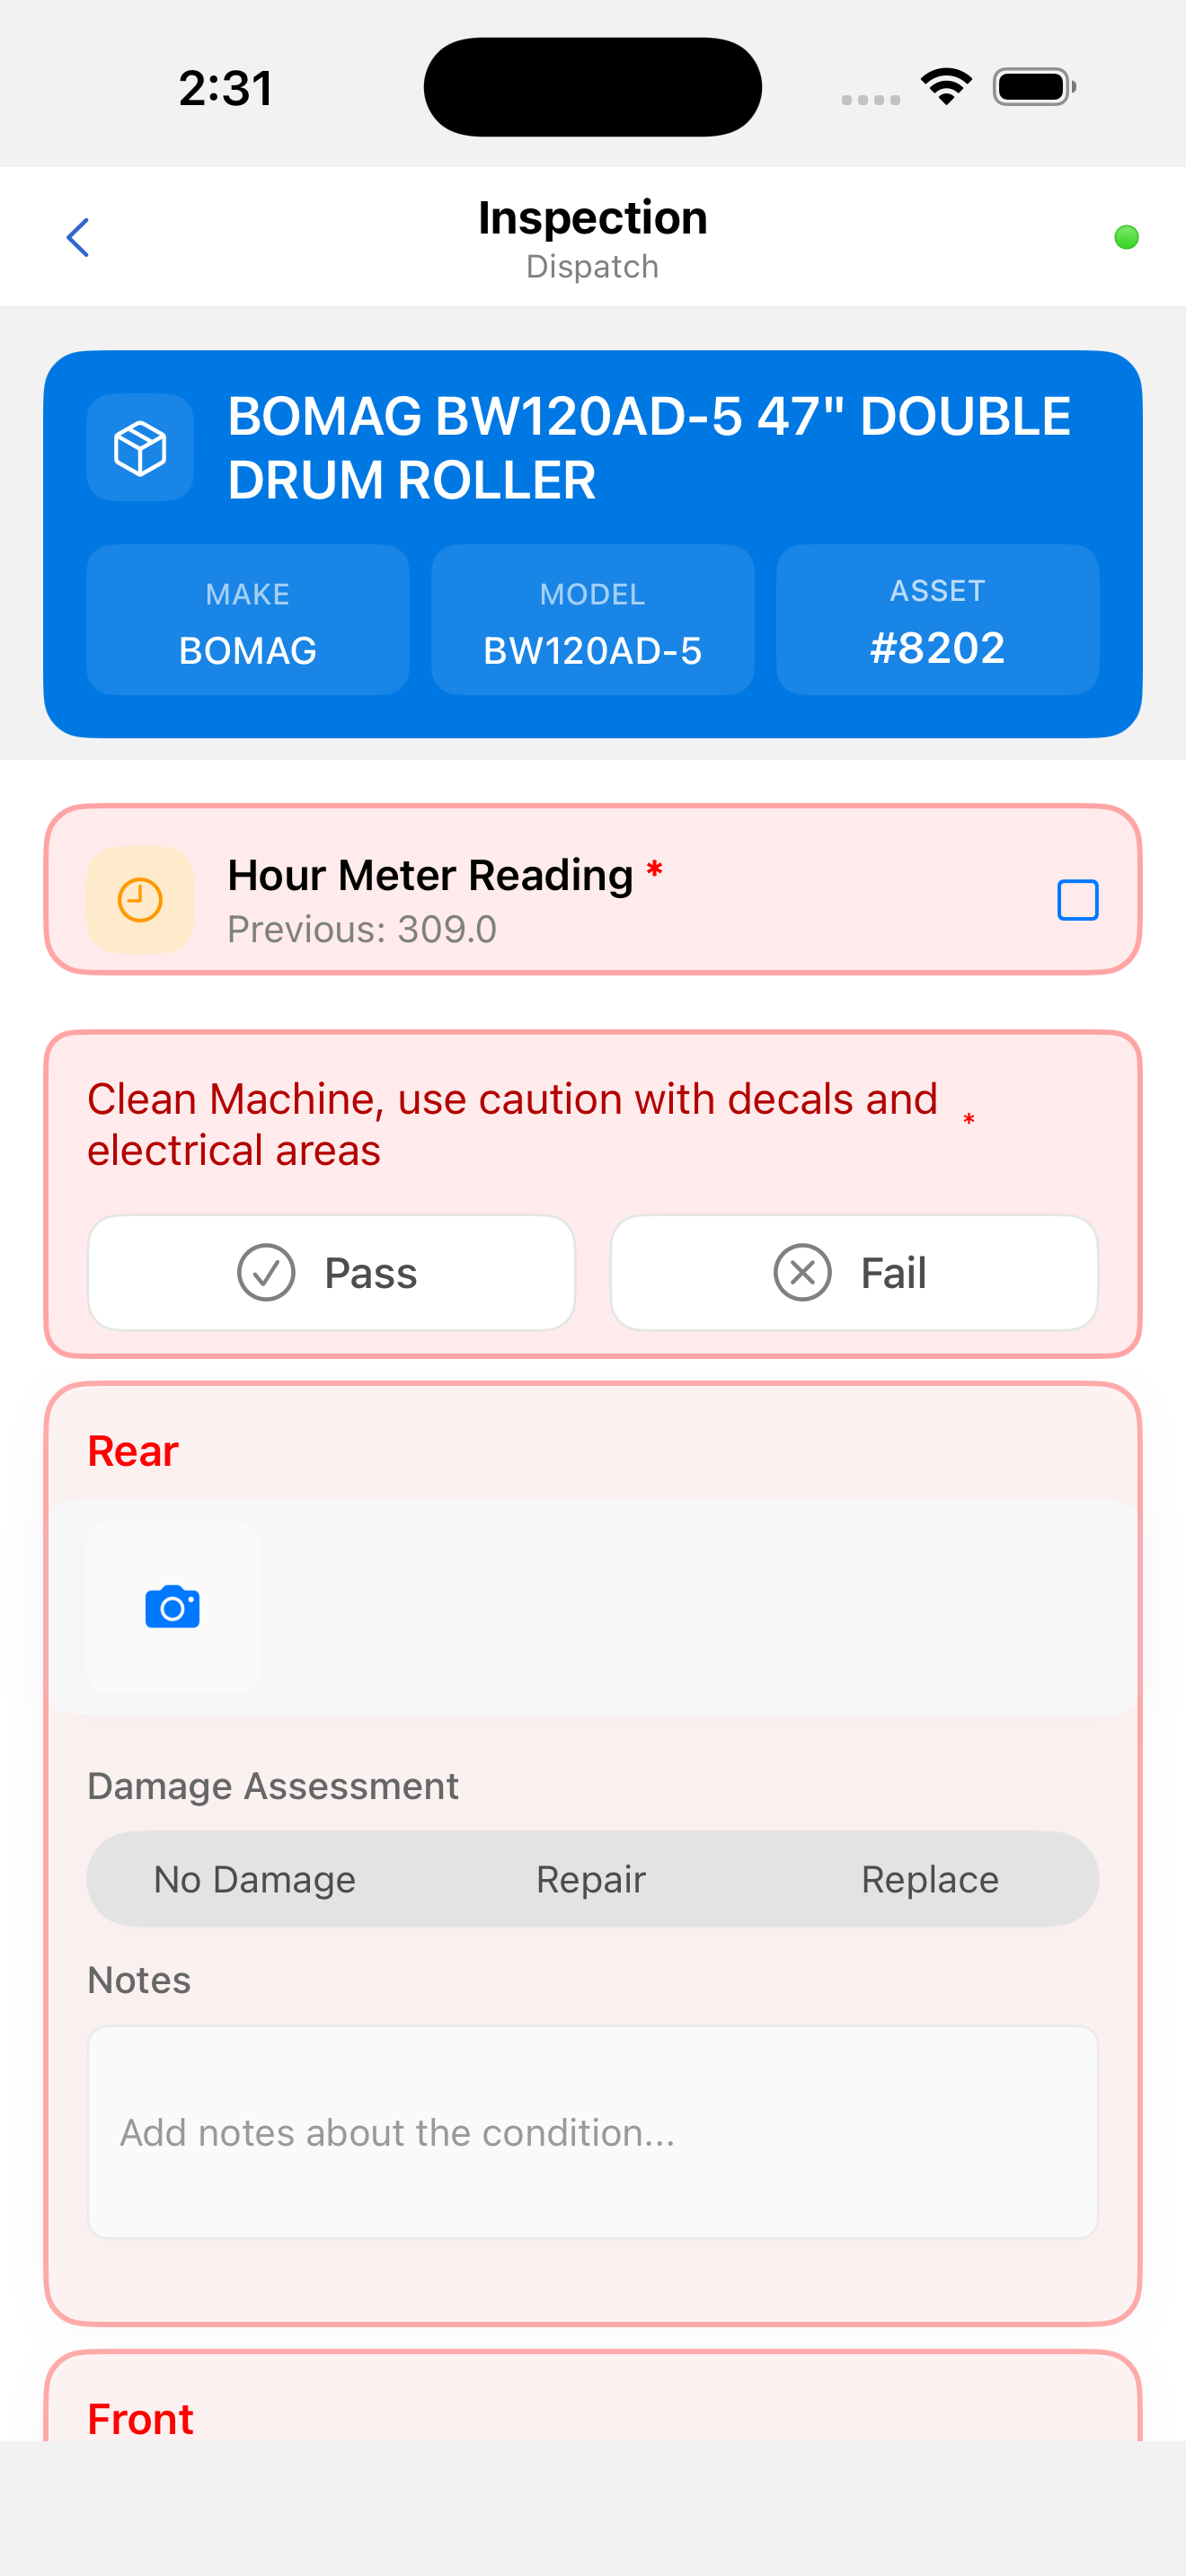
Header
| Element | Description |
|---|---|
| Back arrow (←) | Returns to the work list |
| "Inspection" title | Fixed screen label |
| "Dispatch" subtitle | Identifies this as a dispatch inspection |
| Sync status dot | Real-time connectivity indicator |

Inspection Items List
The main content is a scrollable list of inspection items, the individual checks required for this inspection. Items appear in the exact order received from the backend. The application does not reorder or group items.
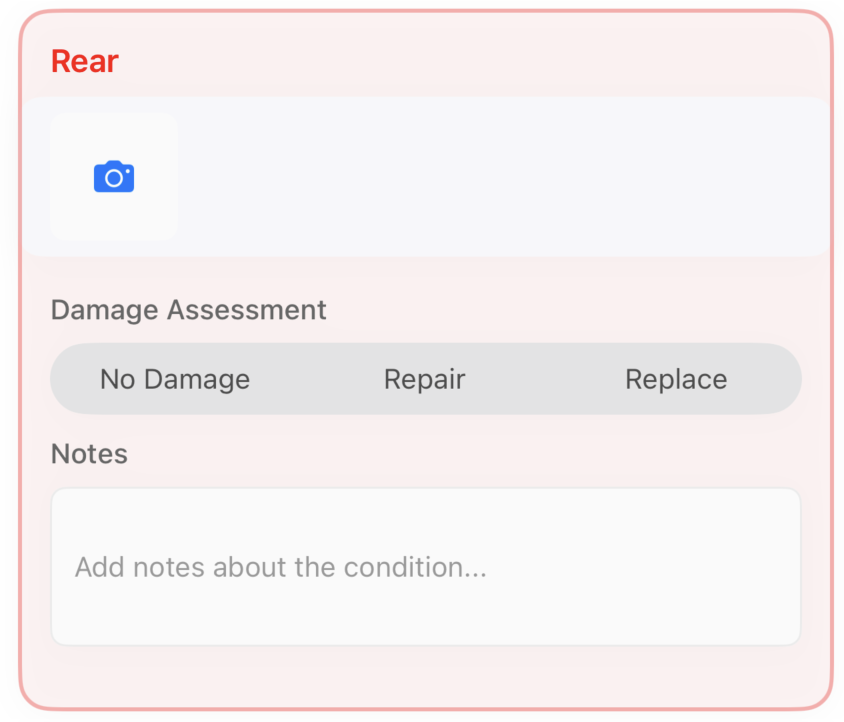
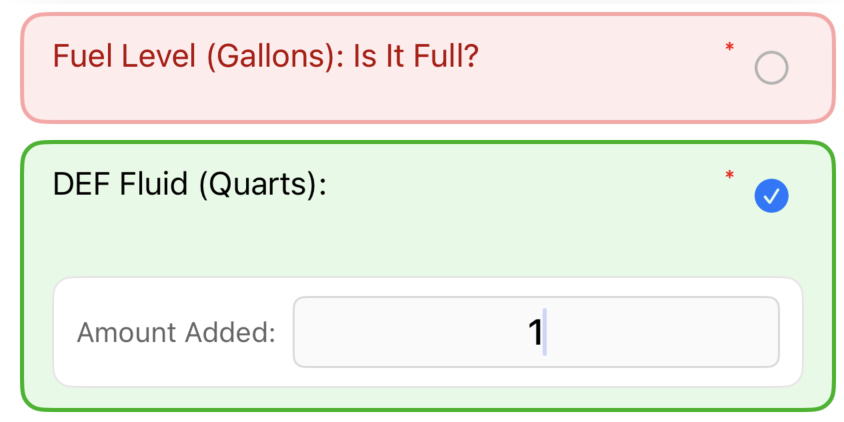
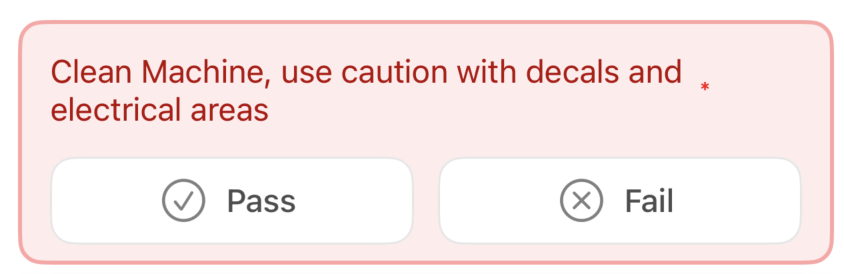
| Element | Description |
|---|---|
| Item name | The name of the check, measurement, or assessment |
| Current result | The recorded value if already completed |
| Completion indicator | Visual mark showing whether the item is done |
| Required indicator | Items marked required must be completed before the inspection can advance |
Item Input Types
Tapping an item opens it for data entry. The input type depends on how the inspection template is configured in CloudERM:
| Type | Description |
|---|---|
| Multiple Choice | Select one option from a predefined list |
| Yes / No | Binary pass or fail selection |
| Numeric | Enter a measured value (e.g., tyre pressure, fuel level) |
| Text | Free-form notes or observations |
| Photo | Capture one or more photos using the built-in camera |
| Signature | Capture a digital signature |
Fault Recording
If an item reveals a defect, record the fault severity:
| Severity | Color | Meaning |
|---|---|---|
| Minor Fault | Orange | Defect noted, asset remains in service |
| Major Fault | Red | Defect requires the asset to be taken out of service |
The fault severity is reflected in CloudERM and in any linked task records.
Photo Evidence
For items requiring photos, the built-in camera opens with markup tools available. See Custom Camera and Image Annotation for full details. Photos are attached directly to the inspection item and stored in CloudERM.